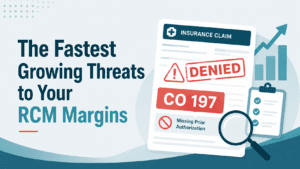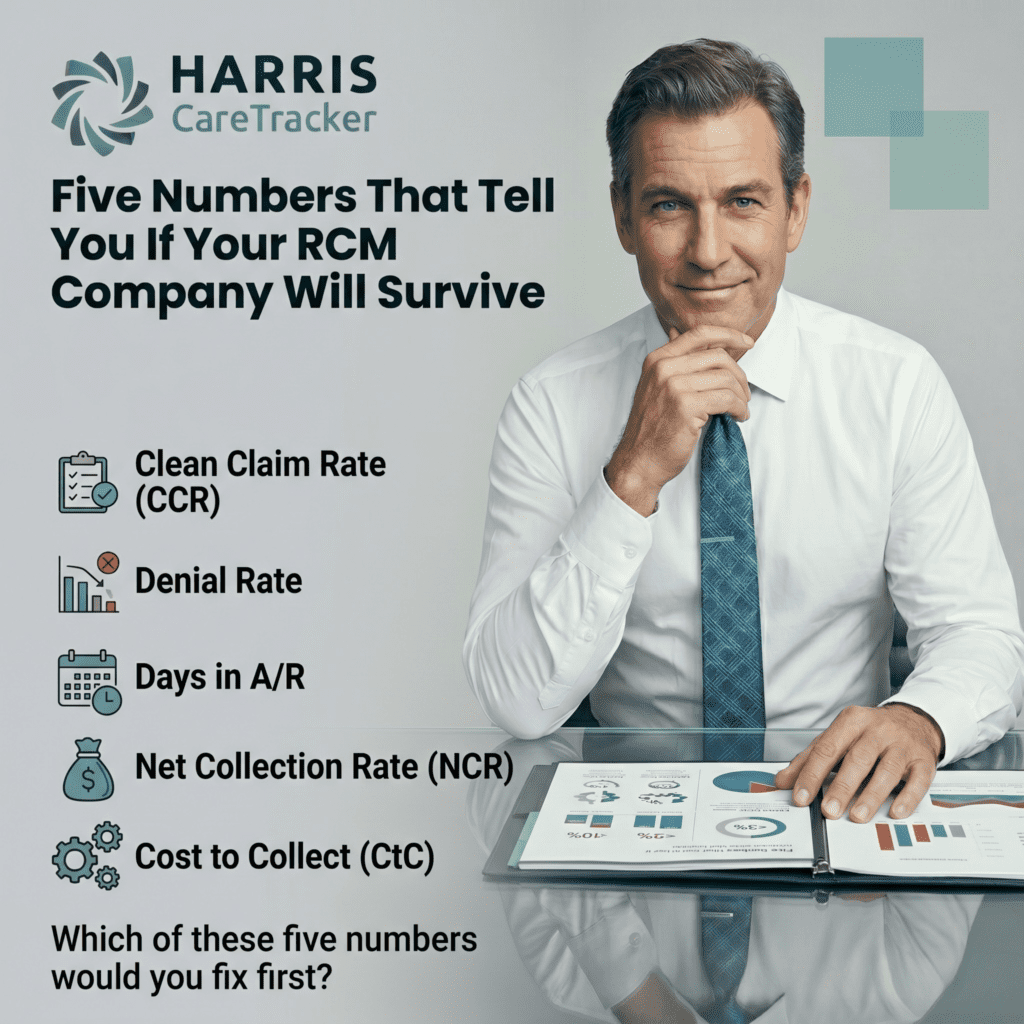
Your billing company will either be competitive in three years or it will not, and five metrics predict which side you land on. Clean claim rate, denial rate, days in A/R, net collection rate, and cost to collect. If you do not track these weekly, you are flying blind. If you do track them and the numbers are below best practice, you now know exactly where your operation is breaking.
Revenue tells you where you are today. These five numbers tell you where you are headed.
I spent 30 years in clinical and revenue cycle operations before coming to HARRIS CareTracker. In that time, I never saw an RCM company fail that was hitting best practice on all five of these metrics. And I never saw one thrive that was missing on more than two. That is not a coincidence. These numbers are the structural health scan of your business.
Clean Claim Rate: The Metric That Drives Everything Else
Percentage of claims paid on first submission. Best practice exceeds 95%. Below 90% signals front end verification or coding failures that are compounding every day you do not fix them.
This is the most telling number in your operation because every claim that fails on first pass triggers a chain of costs. $25 to $118 in rework overhead. Extended payment timelines. Staff diverted from productive work to corrective work. Client dissatisfaction as days in A/R stretch past expectations.
Clean claim rate connects directly to your front end. Batch eligibility verification 270/271, accurate demographic capture, proper coding, prior authorization identification. When this number drops, the problem is almost always upstream. Something in your front end workflow is failing, and the rest of your operation absorbs the cost.
If your clean claim rate is below 90%, you do not face a denial problem. You face an architecture problem. And no amount of back end effort will fix a front end failure.
Denial Rate: The Measure of Operational Maturity
Percentage of total claims rejected. Best practice is below 5%. Top performers hit under 2%. The industry average sits at 11.65%.
Over 40% of providers now report denial rates above 10%. If you are operating in that range, the economics are punishing. Between 86 and 90% of denials are preventable, which means the bulk of your rejection volume comes from failures within your control.
Denial rate is not a measure of payer difficulty. It is a measure of how well your systems, workflows, and technology prevent errors before claim submission. Payers are part of the equation, but the root causes almost always trace back to your operation.
A medical billing director captured the frustration on LinkedIn: “Denials are piling up, underpayments are becoming normal, and every payer seems to carry a new rule every month.” That is a real experience. But the RCM companies posting denial rates under 5% face the same payers. The difference is in the infrastructure, not the payer environment.
Track this weekly. Denial patterns emerge fast and compound faster.
Days in A/R: What Your Clients Care About Most
Average days to payment after service. Best practice is under 40. Above 60 signals systematic follow up breakdowns.
This is the number your clients feel in their bank account. A practice can tolerate imperfect denial rates if the money arrives predictably. When days in A/R pushes past 60, confidence erodes and they start shopping for your replacement.
One RCM owner heard it directly: “What scares me is that revenue looks fine on paper, but money just isn’t landing in the account the way it used to. We’re chasing claims from 60 to 90 days ago.” That is a practice describing the symptom of high days in A/R, and it is one conversation away from becoming a lost client.
For your operation, high days in A/R signals denied claims sitting in rework queues too long, inconsistent follow up processes, or a technology stack that does not support automated claim tracking. Whatever the cause, every day above the 40 day benchmark reduces the probability of full collection. Timely filing deadlines approach. Documentation goes stale. Staff attention shifts to newer claims.
Net Collection Rate: The Only Question Clients Ask
Percentage of contractually allowed revenue actually collected. Best practice exceeds 95 to 96%.
Cost to Collect: Your Margin Equation in One Number
Percentage of revenue spent on RCM operations. Best practice is 3 to 5%.
If you are spending 6 or 7% of collected revenue on operations, you are above the threshold that keeps independent RCM companies profitable. And the silent driver is almost always technology fragmentation. Running four or five disconnected systems creates a 15 to 20% operational cost premium through manual handoffs, data reconciliation, and error correction.
Cost to collect also reveals whether your operation can scale. If adding clients increases this number, your infrastructure cannot support growth. You will grow revenue while shrinking margin. That is the path to working harder for less money.
This metric strips away everything else and answers the question your clients care about: did you get my money?
Below 95%, you are leaving revenue on the table. That loss comes from unworked denials, late follow up, underpayments that were not appealed, COB failures, or secondary coverage that was never identified.
A physician on LinkedIn put it sharply: “Most physicians aren’t losing revenue from patients. They’re losing it inside their own system.” Your clients hired you to stop that leakage. Net collection rate above 96% is the answer that wins new clients and keeps existing ones.
What These Numbers Tell You About Your Future
Enterprise platforms are benchmarking against these same metrics. They invest in AI powered analytics, consolidated technology, and automated workflows to push these numbers toward best practice.
If your clean claim rate sits below 90%, your denial rate is above 10%, your days in A/R exceeds 60, your net collection rate is below 95%, and your cost to collect runs above 5%, the gap between your operation and the enterprise alternatives your clients can choose is wide and widening.
HARRIS CareTracker gives RCM companies the infrastructure to move these numbers. Consolidated platform under one login. Real time RCM reporting tools showing denial spikes, collection velocity, and A/R aging across all client accounts. Enforced workflows. Automated eligibility verification. The architecture to compete on metrics, not just on relationships.
These five numbers do not lie. And they do not improve on their own.
Which one would you fix first?
Follow for more on denial rate benchmarking tools, RCM reporting tools, and building billing companies that last.
Frequently Asked Questions
Why is clean claim rate the most telling metric for an RCM company?
What denial rate should a billing company with under 50 employees target?
How does days in A/R affect client retention for RCM companies?
What is a healthy cost to collect for a small RCM company?
How does HARRIS CareTracker help billing companies track these five metrics?
About the Author
Thomas Koehl is a 30 year health technology veteran serving as COO of International Medical Alliance, with leadership roles at Harris CareTracker and QRS Healthcare Solutions spanning sales, marketing, and revenue cycle management. Served as the Director of a large medical clinic in New Orleans that provided medical care for over 32,000 patients after Hurricane Katrina, He has testified before the U.S. House Committee on Energy and Commerce as an expert witness on disaster healthcare delivery. He writes about the business, strategy, and human side of health technology for the practitioners and leaders who are actually living it.