Claim denials cost the healthcare industry $262 billion a year in initially denied claims. The all payer initial denial rate climbed to 11.8% in 2024, up from 10.2% in 2020. Hospitals lost $48.4 billion to denials and uncollected balances in 2025, a 25% jump from $38.6 billion the year before. If you run a billing company, denial management is not one of your problems. It is the problem that determines whether your operation survives.
That is the bottom line. Denial rates are rising every year, across every category, across every payer type. The question your billing company needs to answer is whether you are going to keep chasing denials after they happen or start preventing them before they occur. The data makes the answer obvious. Prevention costs less than rework on every metric. But most billing companies with 1 to 50 employees are still running reactive models because they never paused to look at the numbers.
After 18 years consulting in the RCM industry, I can tell you that the billing companies posting denial rates under 4% are not working harder than the ones posting 12%. They are working on a different problem. They stopped treating denials as individual events to rework and started treating them as system failures to eliminate. That distinction is the entire game.
The Economics That Should Stop You Cold
The average administrative cost to rework a single denied claim rose from $43.84 in 2022 to $57.23 in 2023. Complex appeals involving clinical documentation or peer to peer review run $118 to $181 per claim. Industry wide, providers spend $25.7 billion annually adjudicating and fighting denials, a 23% increase over the prior year, on top of nearly $20 billion in provider rework labor.
Those are not abstract industry numbers. That is your staff on the phone with payers. That is your team researching denial codes, drafting appeals, resubmitting claims, and tracking follow up. Every dollar of that cost comes directly out of your 2 to 4% operating margin.
And here is the number that reveals the real damage: 65% of denied claims are never appealed at all. Not because they are unrecoverable. Because the labor cost of appealing exceeds the claim value, or because your team ran out of bandwidth. The industry calls this the “70/35 gap.” 70% of denials are overturned when providers appeal them. But only 35% ever get appealed. The other 65% get written off.
For a mid size practice billing $1.5 million annually at the 11.8% industry average denial rate, that gap represents $50,000 to $120,000 in recoverable annual revenue left on the table. Your client hired you to collect that money. It is sitting there. And the system you are running cannot reach it.
The Root Causes Did Not Change. They Got Worse.
Experian Health’s 2025 State of Claims survey of 250 revenue cycle leaders identified the top denial drivers. They are the same categories as 2024. They are all worse.
Missing or inaccurate claim data causes 50% of denials, up from 46% in 2024. Prior authorization issues cause 35%. Incomplete or incorrect patient registration data causes 32%, up from 30%. Coding inaccuracies cause 24%. Services not covered by the plan cause 23%.
At the transaction code level, roughly 75% of all denials trace back to five or six CARC categories. CO 45 (charge exceeds allowed amount) accounts for 28%. CO 16 (missing or invalid information) accounts for 20%. CO 97 (bundled into another procedure via NCCI edit) accounts for 15%. CO 50 (not medically necessary) accounts for 12%. CO 29 (timely filing limit exceeded) accounts for 10%. CO 15 (authorization not obtained) accounts for 8%.
Look at those categories. CO 16, CO 97, and CO 15 are all preventable at the front end. Missing information, bundling errors, and authorization failures. Together they account for 43% of all denials. These are not clinical judgment calls. These are process failures that technology and workflow design can eliminate before claim submission.
CO 29, timely filing, is permanent. Once you miss the deadline, the revenue is gone. No appeal, no rework, no recovery. That 10% of denials represents money that died because of a process breakdown in your operation.
The Payer and Specialty Picture Makes It Worse
Payer mix determines your denial exposure more than most billing companies realize.
Medicaid inpatient claims face a 44% initial denial rate. Commercial inpatient claims face 21%. UnitedHealthcare runs at 15.6%. Managed Medicaid at 18%. Cigna at 13%. Medicare Advantage at 10.5 to 11%. Traditional Medicare fee for service runs the lowest at 5 to 5.4%.
If your client portfolio is heavy on Medicaid and commercial payers, your denial volume is structurally higher than a billing company running mostly traditional Medicare. Your staffing, technology, and workflow design need to account for that. Most do not.
Specialty mix compounds the problem. Behavioral health practices face a 16% average denial rate. Anesthesia runs at 14%. Orthopedics at 13%. Cardiology at 12.5%. Emergency walk in clinics at 12%. General medicine at 10%. Family practice and OB/GYN at 9%. Dermatology at 8%.
If you serve behavioral health and orthopedic practices through commercial and Medicaid payers, your denial exposure is two to three times higher than a billing company serving dermatology practices through traditional Medicare. The same denial management infrastructure cannot serve both scenarios. Your systems, staffing, and workflows need to match your actual risk profile.
Clinical Denials Are Rising Fastest
The most alarming trend in the 2025 data is the 8.3% year over year increase in clinical denials, rising to 2.6% of all claims. Clinical denials are where payers dispute medical necessity or documentation adequacy rather than administrative accuracy.
These are the hardest denials to prevent and the most expensive to appeal. They require clinical documentation review, potential peer to peer calls, and detailed appeal narratives that reference medical necessity criteria specific to each payer. Your billing team cannot handle these alone. They require coordination with providers, access to clinical records, and familiarity with payer specific coverage determination policies.
The rise in clinical denials signals that payers are tightening medical necessity scrutiny, particularly commercial and Medicare Advantage plans. AI driven audit algorithms on the payer side are identifying documentation patterns that used to pass review. The bar for getting claims paid is rising. And it is rising faster than manual denial management processes can adapt.
The Five Interventions That Top Performers Use
The industry consensus has shifted from reactive appeals to front end prevention because 80 to 85% of denials are preventable. Five interventions produce the highest return.
First, real time eligibility verification 48 to 72 hours before service. This alone addresses roughly a quarter of preventable denials. At HARRIS CareTracker, we run batch eligibility verification 270/271 at multiple stages before service, surfacing only the exceptions that need human attention.
Second, payer specific clean claim scrubbing at submission to catch missing and invalid data before it reaches the payer. CO 16 denials (missing or invalid information, 20% of all denials) are almost fully preventable with automated claim scrubbing rules that flag problems before claim submission.
Third, running NCCI bundling edits before submission to catch CO 97 issues. This is worth noting because 34% of NCCI bundling edits cannot be overridden by any modifier regardless of documentation. If your claim scrubber does not catch these before submission, the denial is guaranteed.
Fourth, annual coder training refreshed on ICD 10, CPT, and HCPCS updates. Coding inaccuracies cause 24% of denials. Most coding errors are not mistakes. They are outdated knowledge from coders who did not get updated training when guidelines changed.
Fifth, a dedicated denial management workflow that appeals every overturnable denial within 48 hours of receipt. This closes the 70/35 gap. If 70% of appealed denials are overturned, the ROI on a disciplined appeals process is massive. The billing companies leaving 65% of denials on the table are abandoning revenue their clients already earned.
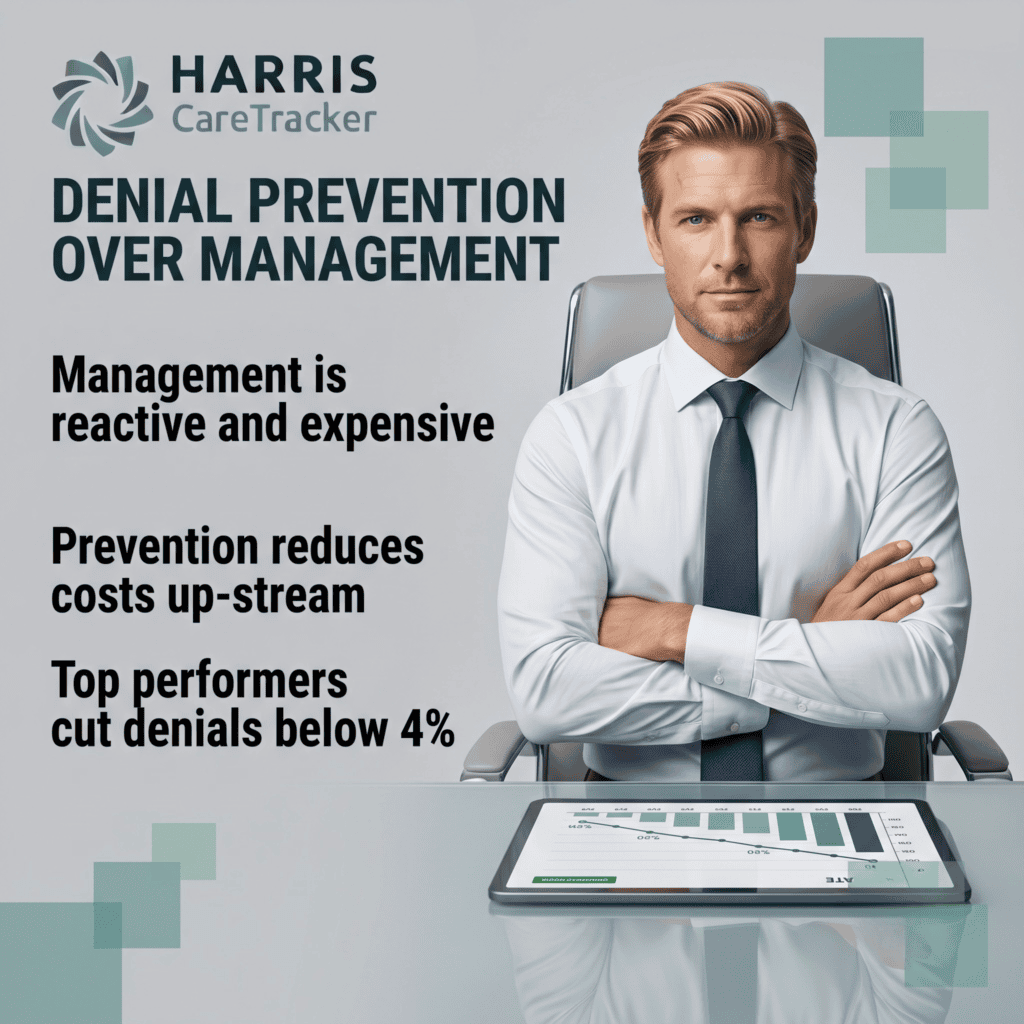
Top quartile practices that implement all five disciplines maintain denial rates below 4%. The industry average is 11.8%. That gap is not talent. It is infrastructure.
How HARRIS CareTracker Addresses This
At HARRIS CareTracker, we built the platform for billing companies that need to run all five of these interventions from a single environment.
Automated batch eligibility verification 270/271 at multiple stages before service. Automated claim scrubbing against NCCI edits and payer specific rules before claim submission. Claim denial management workflows that route rejected claims to the right staff member with context. Real time dashboards showing denial rate, clean claim rate, days in A/R, and net collection rate across all client accounts from a single screen. Enforced workflows that standardize how every team member processes claims regardless of experience level.
One login. Dedicated client workspaces with complete data isolation. AI powered capabilities that flag high risk submissions before they go out. No more bolting together four or five systems and absorbing a 15 to 20% fragmentation tax on every claim.
The denial data is not going to improve on its own. Rates are climbing. Payer AI is getting sharper. Clinical scrutiny is tightening. The billing companies that will still be competitive in three years are the ones building prevention infrastructure today.
What would change in your operation if you cut your denial rate from the industry average to below 4%?
Follow for more on claim denial management, denial prevention, and revenue cycle management.
Frequently Asked Questions
What is the current average denial rate across all payers?
Why are 65% of denied claims never appealed?
Which CARC codes cause the most denials and which are preventable?
How do denial rates vary by payer type?
What denial rate should a billing company target?
About the Author
Thomas Koehl is a 30 year health technology veteran and currently Director of Marketing at Harris CareTracker. Prior leadership roles at QRS Healthcare Solutions focused on supporting revenue cycle management partners. Following Hurricane Katrina, he served as Director of a large New Orleans medical clinic that delivered care to over 32,000 patients. Koehl has testified before the U.S. House Committee on Energy and Commerce as an expert witness on disaster healthcare delivery. He also volunteers as COO of International Medical Alliance, a nonprofit providing free medical care to impoverished communities in developing countries. He writes about the business, strategy, and human side of health technology for the practitioners and leaders living it day to day.
Follow me here for more breakdowns, and follow HARRIS CareTracker for product updates and resources.